


 |
Illustration showing movement of air through various rooms,
from Lectures on Ventilation (1869) by Lewis W. Leeds. Image via Wikimedia Commons. |
 |
Berenice Abbott (1898 - 1991) created brilliant
|
Our own Earth has a magnetic field of course, and it is really not that different from that of a bar magnet. Certainly, to first order as physicists say, you can imagine our earth with magnetic field lines from pole to pole tracing loops similar to those in the photo in a full three dimensions. The main complication to this picture is the sun, and way the solar wind intereacts with the Earth's magnetic field.
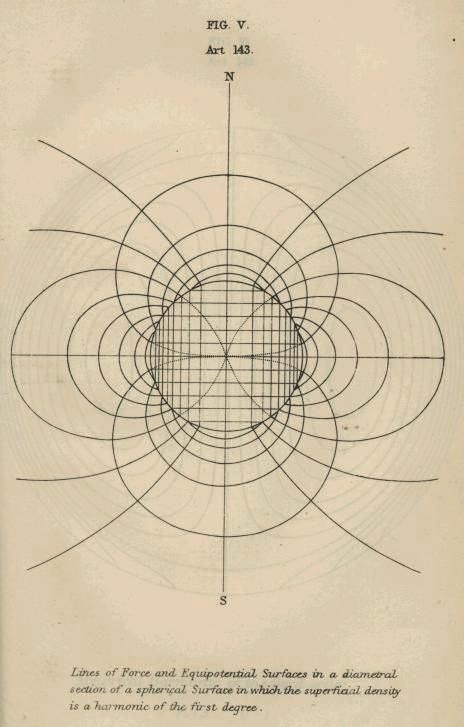 |
| "Lines of Force and Equipotential Surfaces in a diametral section of a spherical Surface in which the superficial density is a harmonic of the first degree" from A Treatise on Electricity an Magnetism, James Clerk Maxwell, 1873 |
 |
| Schematic diagram of how the Sun interacts with the Earth's magnetic field (curtesy of the USGS). The solar wind distorts the field basically compacting the field in on the sunward side creating a bowshock and blowing a long 'magnetotail' outward on the night side of the Earth. Geophysicists use the way these fields interact to probe our planet. We can all enjoy the beauty of the auroras caused by this interaction. Solar storms can also interfer with radio communications, damage GPS and other satellites, and even cause electrical blackouts. |
I love the creative, eerie and entrancing take of Semiconductor (the duo of Ruth Jarman and Joe Gerhardt) take in their short film 'Magnetic Movie'. They let NASA space scientists talk about magnetic field lines, and then animate the Space Science Laboratories at UC Berkeley employing very low frequency radio audio recordings (3 Hz to 30 kHz) as an input for their animated embellishments. They are taking poetic license with reality, but somehow expressing more than we might, if we could literally reveal these invisible fields.
Magnetic Movie from Semiconductor on Vimeo.
They write,
The secret lives of invisible magnetic fields are revealed as chaotic ever-changing geometries . All action takes place around NASA's Space Sciences Laboratories, UC Berkeley, to recordings of space scientists describing their discoveries. Actual VLF audio recordings control the evolution of the fields as they delve into our inaudible surroundings, revealing recurrent ‘whistlers' produced by fleeting electrons . Are we observing a series of scientific experiments, the universe in flux, or a documentary of a fictional world?
Perhaps a little more literal, is another artistic work by Semiconductor, which strives to make the invisible geomagnetic field visible. In '20 Hz' they employ data gathered by CARISMA (the Canadian Array for Realtime Investigations of Magnetic Activity, the magnetometer element of the Geospace Observatory Canada project, operated by U of Alberta) of a geomagnetic storm in the Earth's upper atmosphere - data recorded at the frequency of 20 Hertz (of course). They 'play' the data as the audio track and use the data to generate the visuals.
20 Hz from Semiconductor on Vimeo.
They write,
20 Hz observes a geo-magnetic storm occurring in the Earth's upper atmosphere. Working with data collected from the CARISMA radio array and interpreted as audio, we hear tweeting and rumbles caused by incoming solar wind, captured at the frequency of 20 Hertz. Generated directly by the sound, tangible and sculptural forms emerge suggestive of scientific visualisations. As different frequencies interact both visually and aurally, complex patterns emerge to create interference phenomena that probe the limits of our perception.
No comments:
Post a Comment