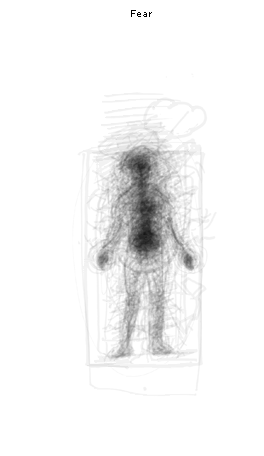
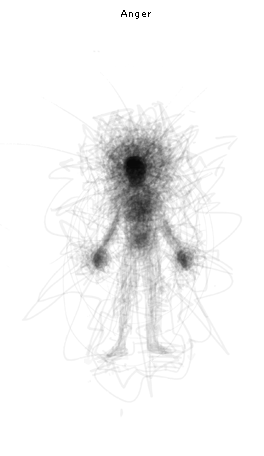
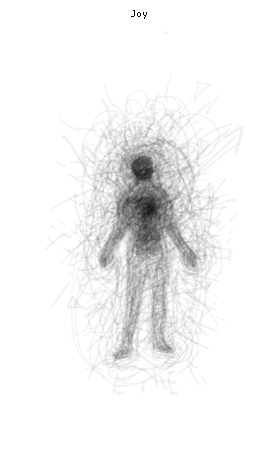
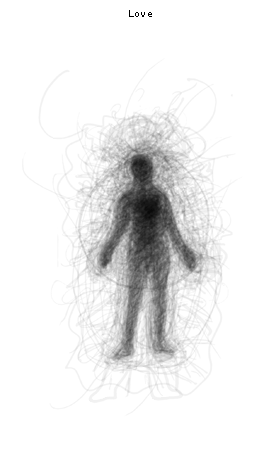
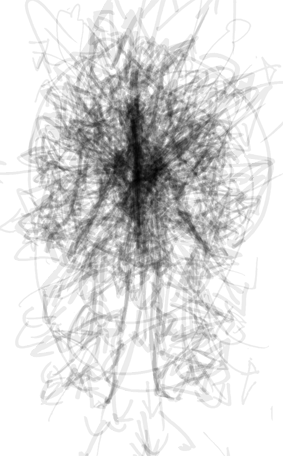
Graphic designer Orlagh O'Brien surveyed 250 men and women (strangers, with varying mastery of English, from 35 countries, from age 6 to 75) to map how and where emotions are felt in a variety of ways, and produced a series of composite images. The images above were gathered by asking, "Q2: How do you feel these emotions in your body? Draw anything you wish."
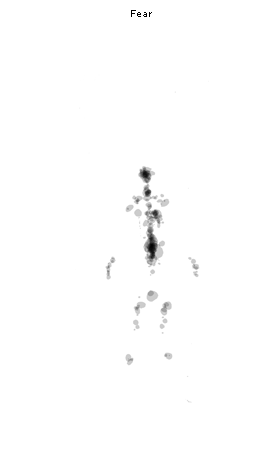
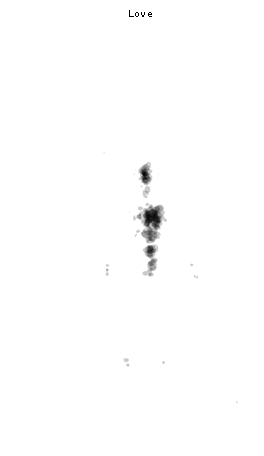
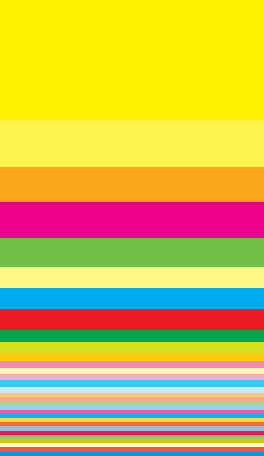
These answers were solicited with the question, "Q3: Where do you feel these emotions in your body? Draw one spot only". She also breaks down results by emotion. This is joy, as mapped by colour ("Q4: What colours do you associate with these emotions? Refer to numbered colour chart,") and direction ("Q5: Do your emotions have direction? If yes, draw arrows,").
 .
.O'Brien writes, "Over time, this method may be developed into a therapeutic tool, and/or a means of visually representing feeling in an interactive, participatory manner."
More at Emotionally vague via curiosity counts.


