'fractal geometry I', fern leaf print and linocut by me, Ele Willoughby, which I shared for #mathyear theme Sierpiński
This last November, Marlene Knoche and Constanza Rojas-Molina launched #Noethember, encouraging mathematicians and artists to share daily images and facts about the great mathematician Emmy Noether. They had so much fun, this year, they are posting weekly prompts for math-related imagery to be shared with the hashtag #mathyear. January was all about fractals. February will be about connections between mathematics and other concepts (like the environment, time, love, and sociology). Find new prompts each month on Knoche's blog and follow the hashtag on Twitter or Instagram to enjoy the math-art!
Oliver Byrne, geometric diagram from Euclid's Elements
You are likely to recognize the geometrical art of Mondrian, usually in primary colours and black, space divided into variable grids with rectangles of colour, and perhaps the work of Theo van Doesburg and others in the De Stijl (Dutch for “the style”) group. Their work, is often seen as a response to the chaos and horrors of WWI and a desire to impose order and structure by taking Cubism to its logical, geometrical extreme. "The Style" has been immensely influential on 20th century art, through other movements like Constructivism and the Bauhaus movement in art, craft and architecture. I don't just these artworks and movements as simply a rejection of chaos, but as an embrace of the tools of scientific and mathematical communication and data visualization of the 19th century.
Consider the 19th-century civil engineer and mathematician named Oliver Byrne and his well-loved 1847 edition of the foundation of geometry Euclid’s Elements. When you look at at his diagrams with modern eyes, De Stijl is what comes to mind. His diagrams in primary colours, red, yellow and blue along with black, on a white field, his use of space all look eerily familiar, though published almost seven decades earlier.
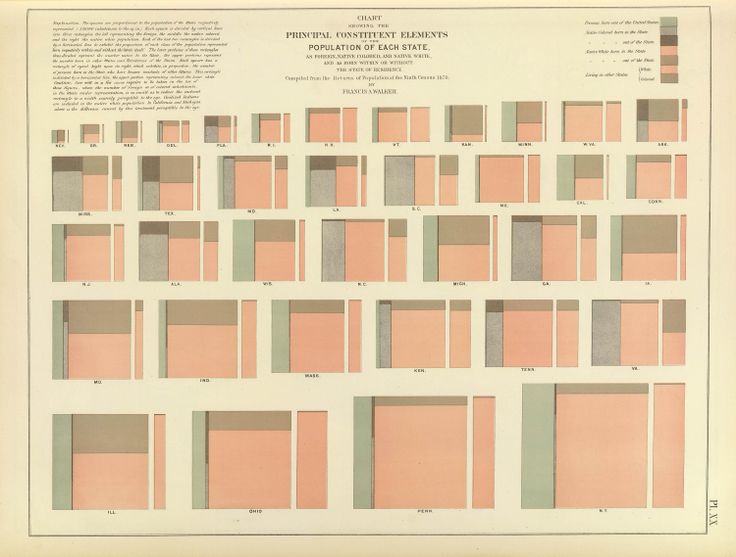
You can see such striped down, elegant graphical design in 19th century data visualizations too. Consider this lovely diagram from the superintendent of the US census for 1870, Francis Amasa Walker, aided by colour lithographer Julius Bien, and how he displayed the data on religious observance:
Francis Amasa Walker, Ninth Census of 1870 (with colour lithographer Julius Bien), chart of religious observance
which brings to mind not only the rectangular shapes of Mondrian but the colour field paintings of Marc Rothko and others (such as this painting by Robyn Denny from as late as 1960). Or this image of demographics by state;
Francis Amasa Walker, Ninth Census of 1870, Principle Constituent Elements of Population of Each State
In the mid 19th century, Elizabeth Peabody made quilts with abstract visualizations of American history so she could take them on tour and discuss drivers of history with students! She designed these grid quilts for her own U.S. history textbook (1856).
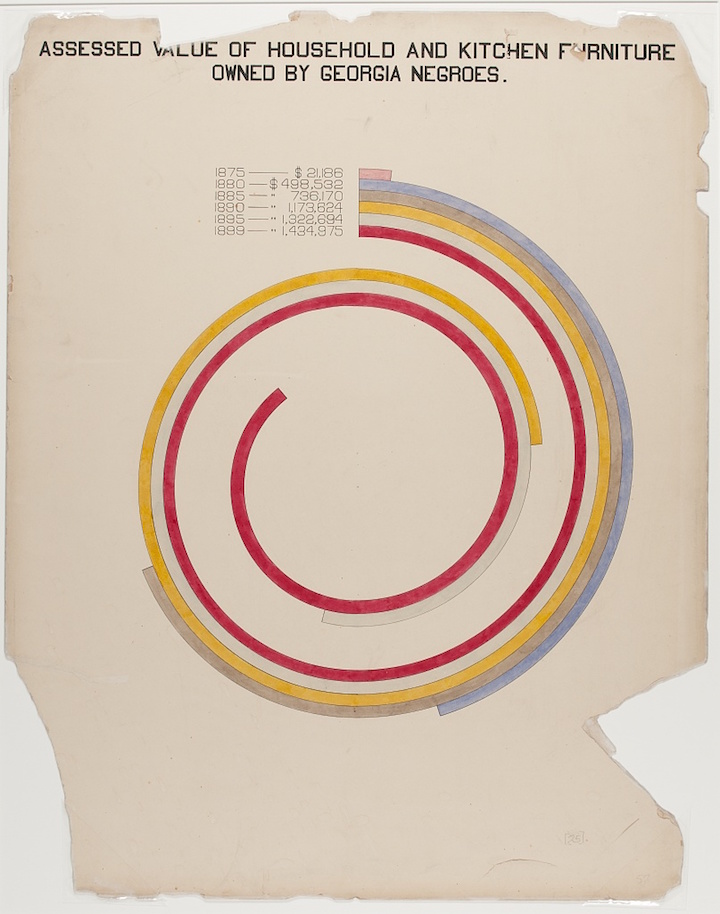
Writer, sociologist, activist and Pan-Africanist William Edward Burghardt “W. E. B.” Du Bois worked with his students in Atlanta to create beautiful, immediate and effective data visualizations of demographics and economic life in Georgia for the “Exhibit of American Negroes,” (organized by Du Bois, Thomas J. Calloway and Booker T. Washington to represent contemporary black contributions to life in the US) at the 1900 Exposition Universelle in Paris. Others have noted these images hint at the coming De Stijl movement; Alison Meier wrote in Hyperallergic, that “they’re strikingly vibrant and modern, almost anticipating the crossing lines of Piet Mondrian or the intersecting shapes of Wassily Kandinsky”.
Data visualizations which clearly made their way into artists' hands, and in fact were often made by artists themselves, include colour charts, like these by American artist Emily Noyes Vanderpoel (1842-1939) from Color problems: A practical manual for the lay student of color.
Emily Noyes Vanderpoel (1842-1939) from Color problems: A practical manual for the lay student of color
Emily Noyes Vanderpoel (1842-1939) from Color problems: A practical manual for the lay student of color
But these are not dissimilar to scholarly works of analysis, not strictly aimed at artists, like this diagram:
Frontispiece to Annie Besant and Charles Leadbetter’s Thought-Forms (1905), ascribing colours to particular emotions – Source.
To me, it does not seem a large leap from these grids of colours squares, or clean, simple geometric data visualizations to De Stijl.
Theo van Doesburg, Kleurkwadraat, 1926
Theo van Doesburg De zaaier Design for Leaded Light Window 1921 Collection Museum Drachten.
A 1921 painting by Piet Mondrian
Piet Mondrian. Broadway Boogie Woogie. 1942-43
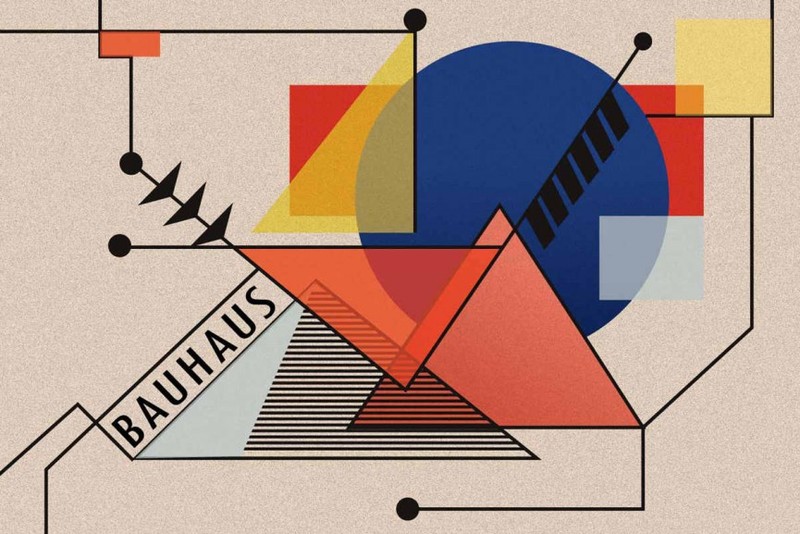
Or the near contemporaneous Constructivism movement in art, with monochromatic shapes "constructing" art and Suprematism with its limited palette, and geometrical shapes and lines, in Russia, and of course the Bauhaus school in Germany which cast long shadows across art, craft and architecture of the entire century.
Wassily Kandinsky, Circles in a Circle, 1923
Kasimir Malevich (1879-1935)
Malevich "Suprematist Composition"
"Walter Adolph Georg Gropius (18 May 1883 – 5 July 1969) from Bauhaus Manifesto
I'm very excited to have curated the Toronto Etsy Street Team Gallery's first group art show, WUNDERKAMMER: The Cabinet of Curiosities from May 11 to 28. This art - or science art - show, is inspired by the Wunderkammer
or Cabinet of Curiosity, the immense, eccentric, encyclopedic
natural history collections gathered by collectors since the
Renaissance. Cabinets of Curiosities featured treasured zoological,
botanical, anatomical, fossil and gem specimen, collected by early
citizen scientists. WUNDERKAMMER features original
sculptures, drawings, hand-bound books, prints, paintings,
printmaking, ceramics, jewellery, generative and multimedia specimen
of natural and unnatural history on all scales, from the microscopic
to the macroscopic. We are featuring the work of local artists (myself
included):
István Aggott Hönsch
Erin Candela
Gavin Canning
Andrée Chénier
Carolyn Eady
Leslie Fruman
Monika Millar
Heather Ibbott
Colleen Manestar
Peggy Muddles
Teodora Opris
Christine Strait-Gardner
Tosca Teran
Rovena Tey
Lauren Vartanian
Ele Willoughby
Explore our curiousity cabinet of wildlife biology, mathematics,
chemistry, mycology, micro and cellular biology, marine biology,
entomology, botany, and fantastical lifeforms through the lens of art.
Join us Saturday, May 13, 6:00 pm to 10:00 for our Opening! FOLLOW THE LINK TO RSVP
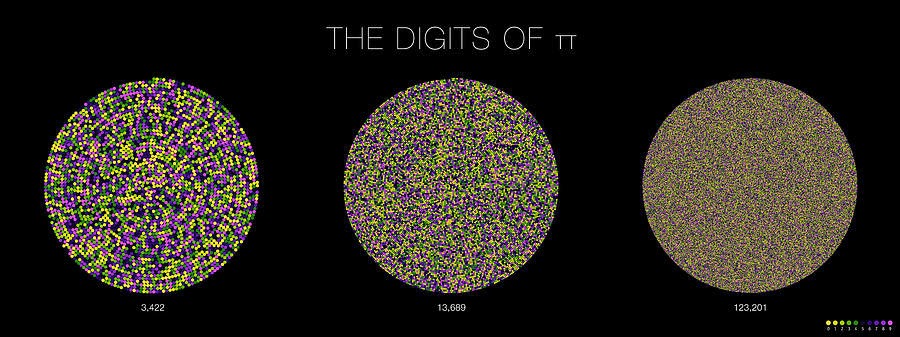
Today we celebrate π day, because (non-metric) Americans write the date 3/14, like the first three digits of the digital expansion of the ratio of the circumference of a circle to its diameter. Enjoy with some mathy Kate Bush and yet another incredible math-art work about pi by Martin Krzywinski. This year he's translated the 12,000,000 digits of Pi into star charts (by taking blocks of 12 digits and using them as latitude, longitude and azimuth). Then he's selected 80 constellations from these imagined stars and named them after extinct plants and animals. Find more here!
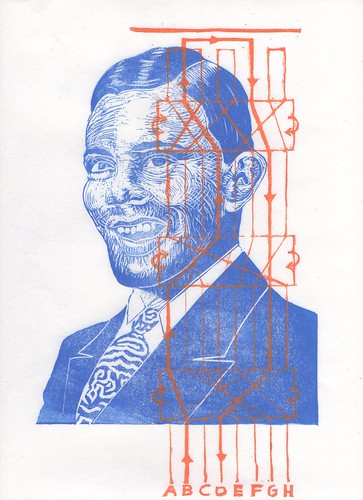
I've written previoulsy about Turing, for the centenary of his birth. To celebrate his 103rd birthday, I'm sharing my portrait of him complete with a schematic of the Enigma machine. I had long thought to portray Alan Mathison Turing, OBE, FRS (23 June 1912 – 7 June 1954), British mathematician, cryptanalyst, computer scientist, prophet and hero, but was stumped. My scientists are shown with images of something quintessential to their science, or the reason they are famous (or should be), but Turing had so many accomplishments, it wasn't obvious what to portray or how. Turing is the subject of this year's biopic The Imitation Game. You might recall his portrayal in Neal Stephenson's 'Cryptonomicon'. I was introduced to him many year ago by Douglas Hofstadter's 'Gödel, Escher, Bach'. You may also be familiar with the Turing Test or at least its portrayal in Blade Runner. Turing foresaw not only that machines might quite likely develop the capacity to think (after all, our brains are only made of matter, and complex systems of neurons, which either fire or not, much like an electronic switch), but that we needed an objective, double-blind test to determine whether something/someone was able to think, as early as 1950, when most people were only dimly aware of the existence of any sort of computer. But Turing quite literally defined what we now mean by computation itself (with his concept of Turing Machines) back in 1936. During the WWII he worked as a codebreaker and invented the device which was finally able to crack the notorious German cryptographic Enigma machine (in its more complex later incarnation)! His work undoubtedly saved many lives, and today we recognize him as a genius and a hero. In my print, I've included a simplified diagram of the mechanism behind the Enigma with its rotors or scramblers which acted as monoalphabetic substitution ciphers, literally scrambling letters at each turn. During, his all too short life, he also made important contributions to mathematical biology and explaining morphogenesis (the biological process that causes an organism to develop its shape) and the existence of Fibonacci numbers in biology. To indicate this later work, I've made the pattern of his tie look like the sort of Turing pattern produced by reaction–diffusion systems. This work presaged much later work in chaos theory.
Tragically, he lived in a time even more biased and bigoted than our own. Rather than recognizing the magnitude of his contributions to society during his lifetime, he was prosecuted for his homosexuality (still illegal in Britain in 1952) and forced to undergo chemical castration. He died two years later, after eating a cyanide-poisoned apple (determined by the coroner to be a suicide - something his mother vigorously denied). It is truly abominable they way he was treated; while we can't address the past injustice we can remember, recognize and celebrate his remarkable achievements today.
There are many serious looking photos of Turing. I chose one of him smiling as inspiration for this portrait. He clearly enjoyed his work, and had a sense of humour (evident in the silly names he gave mathematical techniques he discovered), so I chose to remember him laughing.
If you like numbers, you cannot help but like one as famous as the ratio of the circumference of a circle to its diameter, π. Likewise, what's not to like about π day? I confess, I like to write the date in the metric fashion (day, month, year), but if you represent it numerically the way we say it in English, March 14, '15 looks like the first several digits of this famed irrational: 3.1415 (and this post is scheduled for 9:26 to continue with the fun).
path connecting segments traces out the digits
of π. Here the transition for the 6 digits is
is shown. Concept by Cristian Ilies Vasile.
Created with Circos.
Martin Krzywinski, bioinformatics researcher and artist, has created a number of artistic representations of π (and other mathematical concepts) at that place where scientific visualizations meet art. He created Circos, a software package for visualizing data and information in a circular layout; he writes, "Cristian Ilies Vasile had the idea of representing the digits of π as a path traced by links between successive digits".
He found that they could weave a mandala by continuing this process. Then he proceeded to add more employing concentric circles of dots to indicate the number of transitions between any two figures. The colour of the dot indicates which figure (0 through 9) was visited next and the size is proportional to frequency of a given transition.
Check out his other lovely and fascinating projects (including how he mapped π on an Archimedean spiral, as above) on his site.
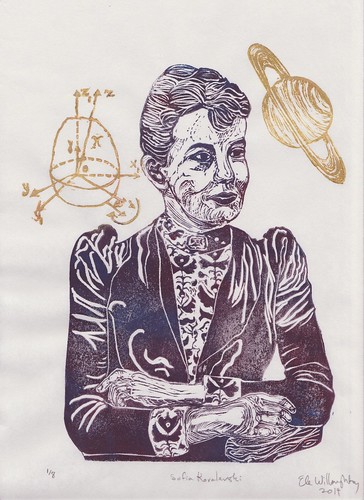
'Sofia Kovalevski', linocut 9.25" by 12.5" (23.5 cm by 32 cm), 2014 by Ele Willoughby
Today is the birthday of the great Russian mathematician and writer, Sofia Vasilyevna Kovalevski (1850-1891), in honour of which, I'm going to make the first of a series of posts about scientists I've portrayed.
Also known as Sofie or Sonya, her last name has been transliterated from
the Cyrillic Со́фья Васи́льевна Ковале́вска in a variety of ways,
including Kovalevskaya and Kowalevski. Sofia's contributions to
analysis, differential equations and mechanics include the
Cauchy-Kovalevski theorem and the famed Kovalevski top (well, famed in
certain circles, no pun intended). She was the first woman appointed to a
full professorship in Northern Europe or to serve as editor of a major
scientific journal. She is also remembered for her contributions to
Russian literature. All of this despite living when women were still
barred from attending university. Her accomplishments were tremendous in
her short but astonishing life.
Born Sofia Korvin-Krukovskaya,
in Moscow, the second of three children, she attributed her early
aptitude for calculus to a shortage of wallpaper, which lead her father
to have the nursery papered with his old differential and integral
analysis notes. Her parents nurtured her early interest in math, and
hired her a tutor. The local priest's son introduced her to nihilism. So
both her bent for revolutionary politics and passion for math were
established early.
Unable to continue her education in Russia,
like many of her fellow modern, young women including her sister, she
sought a marriage of convenience. Women were both unable to study at
university or leave the country without permission of their father or
husband. Men sympathetic to their plight would participate in
"fictitious marriages" to allow them an opportunity to seek further
education abroad. She married the young paleontology student, Vladimir
Kovalevsky, later famous for his collaboration with Charles Darwin. They
emigrated in 1867, and by 1869 she enrolled in the German University of
Heidelburg, where she could at least audit classes with the professors'
permission. She studied with such luminaries as Helmholtz, Kirchhoff
and Bunsen. She moved to Berlin and studied privately with Weierstrass,
as women could not even audit classes there. In 1874, she present three
papers, on partial differential equations, on the dynamics of Saturn's
rings (as illustrated in my linocut) and on elliptic integrals as a
doctoral dissertation at the University of of Göttingen. Weierstrass
campaigned to allow her to defend her doctorate without usual required
lectures and examinations, arguing that each of these papers warranted a
doctorate, and she graduated summa cum laude - the first woman in
Germany to do so.
She and her husband counted amongst their
friends the great intellectuals of the day including Fyodor Dosteyevsky
(who had been engaged to her sister Ann), Thomas Huxley, Charles Darwin,
Herbert Spencer, and George Elliot. The sentence "In short, woman was a
problem which, since Mr. Brooke's mind felt blank before it, could
hardly be less complicated than the revolutions of an irregular solid."
from Elliot's Middlemarch, is undoubtedly due to her friendship with
Kovaleski. Sofia and Vladimir believed in ideas of utopian socialism and
traveled to Paris to help those the injured from the Paris Commune and
help rescue Sofia's brother-in-law, Ann's husband Victor Jaclard.
In
the 1880s, Sofia and her husband had financial difficulties and a
complex relationship. As a woman Sofia was prevented from lecturing in
mathematics, even as a volunteer. Vladimir tried working in business and
then house building, with Sofia's assistance, to remain solvent. They
were unsuccessful and went bankrupt. They reestablished themselves when
Vladimir secured a job. Sofia occupied herself helping her neighbours to
electrify street lamps. They tried returning to Russia, where their
political beliefs interfered with any chance to obtain professorships.
They moved on to Germany, where Vladimir's mental health suffered and
they were often separated. Then, for several years, they lived a real
marriage, rather than one of convenience, and they conceived their
daughter Sofia, called Fufa. When Fufa turned one, Sofia entrusted her
to her sister so she could return to mathematics, leaving Vladimir
behind. By 1883, he faced increasing mood swings and the threat of
prosecution for his role in a stock swindle. He took his own life.
Mathematician
Gösta Mittag-Leffler, a fellow student of Weierstrass, helped Sofia
secure a position as a privat-docent at Stockholm University in Sweden.
She developed an intimate "romantic friendship" with his sister,
actress, novelist, and playwright Duchess Anne-Charlotte Edgren-Leffler,
with whom she collaborated in works of literature, for the remainder of
her too short life. In 1884 she was appointed "Professor
Extraordinarius" (Professor without Chair) and became the editor of the
journal Acta Mathematica. She won the Prix Bordin of the French Academy
of Science, for her work on the rotation of irregular solids about a
fixed point (as illustrated by the diagram in my linocut) including the
discovery of the celebrated "Kovalevsky top". We now know there are only
three fully integrable cases of rigid body motion and her solution
ranks with those of mathematical luminaries Euler and Lagrange. In 1889,
she was promoted to Professor Ordinarius (Professorial Chair holder)
becoming the first woman to hold such a position at a northern European
university. Though she never secured a Russian professorship, the
Russian Academy of Sciences granted her a Chair, after much lobbying and
rule-changing on her behalf.
Her writings include the memoir A
Russian Childhood, plays written in collaboration with Edgren-Leffler,
and the semi-autobiographical novel Nihilist Girl (1890).
Tragically,
she died at 41, of influenza during the pandemic. Prizes, lectures and a
moon crater have been named in her honour. She appears in film and
fiction, including Nobel laureate Alice Munro's beautiful novella 'Too
Much Happiness', a title taken from Sofia's own writing about her life.
Even those who do not happen to revel in mathematics, know a little set theory - or least one of its useful visual tools: the Venn diagram. Today would be the 180th birthday of English philosopher and logician John Venn (4 August 1834 – 4 April 1923) remembered for the eponymous diagrams. Somehow by making a way to visualize sets and their intersections, he created a mathematical tool beloved of illustrators and graphic designers. (It's the subject of today's Google doodle). This sort of math one can "see" has made it into - dare I say - a large set of fun and fabulous illustrations. I thought I'd gather some for his birthday.
The diagrams are so recognizable, people even take liberties with the concept and we still understand, say that moustaches are the intersection of shaved areas with facial hair:
"Bowhead," a picture of a sound made by a Bowhead whale, 2003 by Mark Fischer (using wavelet analysis of recorded hydrophone sound data)
Artist Mark Fischer was interested in whalesong and found that in the literature you could find information on the range of frequencies employed, or fourier transforms of recorded sound (so you could see it plotted as a function of frequency, or moreorless which 'notes' were used, if whales happened to use discrete notes like most human music). He decided to use a method common in my field - marine geophysics. He employed wavelet analysis. (If you're interested, this is something seismologists typically use. They take time series data, which means they measure the amplitudes of vibrations, which is often equivalent to measuring the intensity of sound, periodically, so they get a series of measurements in time. They convolve the time series with a wavelet, a specific function. The result is a matrix of numbers which can be displayed as a 2D image if you simply map numbers onto colours.) It suffices to understand that there are a series of numbers (equivalent to the whalesong) to which he applies a mathematical procedure to produce an image. As he writes,
The procedure I have developed to pursue this exploration is, to me, a form of photography- with mathematics as the lens and a computer as a camera. What results is something I call 'the shape of the sound'.
More recently he's produced wavelet images of birdsong and insect noises and what he calls 'AguaSonic' videos of various species, so you can hear the animals too.
Pseudorca Pontinha by Mark Fischer, 2009 17.75" x 23.75" archival digital print on Crane's Museo Max paper
Sound as visual art can also be of sounds closer to the human experience (and not only those which require hydrophones to record). Epic Frequency makes prints of famous audio clips. This one is Martin Luther King, Jr. beginning, "I Have A Dream" On August 28, 1963.
Or, here is a way in which natural sounds combine with sculptural art. 'Hear Heres' is a set of four giant ear trumpet sculptures designed to highlight the sounds of nature, by London architecture firm Studio Weave.
Daniel Starr-Tambor’sMandala (above) is a musical palindrome of 62 vigintillion (1063) notes, which represents musically all the rotational frequencies of the planets (and Pluto) in our solar system! (via Brain Pickings) I've always been a fan of the palindrome (which is something which remains the same if write forward or backward) since my name (Ele) is one of the shortest palindromes. Mandala boasts that it is the longest palindrome ever written, and I do not doubt it.
It's perhaps surprising how lovely the music is to hear, for such a mathematical approach to music composition - though the two languages, math and music, are quite naturally intimately entwined. He's not the first to think of the planetary motions in terms of music. He alludes to Bach (and Bach’s The Art of the Fugue) explicitly, with its contrapunctal mathematical and arguably Pythagorean structure.* The concept of the Music of the Spheres was quite a common way for scholars to think about the motions of heavenly bodies, up to the Renaissance and the Scientific Revolution. It can be traced back to the ancient Greek mathematical-mystic Pythagoras, who first linked musical pitch to the length of a vibrating string which produced it. Further harmonious sounds were produced by strings with simple (rational) length ratios. This fit well with his adoration of rational numbers.** Pythagoras, in his theory of the Harmony of the Spheres, proposed that celestial bodies (Sun, Moon, and the known planets, Mercury, Venus, Mars, Jupiter and Saturn) each emitted a hum based on their period of revolution. Recall, that it was assumed that the Sun, moon and planets orbited around the Earth. Further, that the ratios were harmonious, like those produced by strings of simple length ratios. Thus, for Pythagoras, music and astronomy were two sides of a single mathematical coin. Ptolemy's model of the geocentric solar system, wherein each of Sun, Moon, known planets, and stars (quintessence) were more-or-less pinned to a series of transparent, nested, rotating spheres encapsulating the Earth, dominated the Western world view for 1500 years. Thus "Music of the Spheres" referred to the 'harmonies' of the motions of these imaginary spheres.
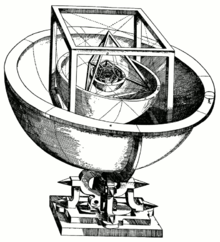
The first real shift in thinking is of course attributed to Copernicus, who proposed a heliocentric model, where the Earth, like the planets, circled the Sun, and the Moon circled the Earth. This model was famously improved by Kepler, who, thanks to Tycho Brahe's immaculately recorded data, was able to show that planetary orbits are in fact elliptical (slightly more oval than a perfect circle), with the Sun at one of the two foci of the ellipse. He further showed that a line joining a planet and the Sun sweeps out equal areas during equal intervals of time. And, that the square of the orbital period of a planet is directly proportional to the cube of the semi-major axis of its orbit. These three facts are known as Kepler's Laws of Planetary Motion. You'll see that they refer to geometry and ratios, just like Pythagoras did before him. In fact, while we tend to honour Kepler as some sort of harbinger of modern science, his worldview was in many ways still Medieval. He did not think in terms of the simple, beautiful, elliptical solar system (as we still know it today). He was obsessed with proportions and attempted to explain astronomical (and worse, to the modern mind) astrological ratios in terms of music, in his own favorite publication Harmonices Mundi. His very first attempt to articulate his discoveries, now known as his three laws, was written in terms of musical notation (above). He wrote, "the movements of the heavens are nothing except a certain everlasting polyphony." (He ended up embroiled in a priority dispute with Robert Fludd, whose own harmonic theory is illustrated as the "THE MUNDANE MONOCHORD WITH ITS PROPORTIONS AND INTERVALS", the stringed instrument with planetary orbits, From Fludd's De Musica Mundana above). He also conceived of it in terms of polyhedra; he imagined the five Platonic solids (octahedron, icosahedron, dodecahedron, tetrahedron, cube) circumscribed by spheres, nested one within the other. This, he claimed, could explain the ratio of orbits of the six known planets (Mercury, Venus, Earth, Mars, Jupiter, and Saturn). Kepler's insights, along with the concept of centrifugal force from Huygens, allowed Newton, Edmund Halley, and possibly Christopher Wren and Robert Hooke to deduce that gravitational attraction between the Sun and its planets decreased with the square of the distance between them. This in turn lead to Newton's Universal Law of Gravitation. So, we owe this groundbreaking idea as much to musical theory, and imaginary geometrical patterns, as rational, mathematically-based reasoning.
*For how Bach encoded his name into The Art of the Fugue, see one of my favorite books, Gödel, Escher, Bach by Douglas Hofstadter.
**We all recall Pythagoras for Pythagoras' theorem (the square of the hypotenus is equal to the sum of the squares of the other two sides for right angle triangles). Imagine his, and his cult's horror when they realized that for one of the simplest triangles, where "the other two sides" each have length of 1 unit, the hypotenus must have an irrational √2 length! The irrationality of √2 did not fit into the tidy rational, mathematical world of the Pythagoreans. It was perhaps the first of a long series of instances where the beauty of mathematics was mistaken for something tidy and controllable.
Since we're talking about Möbius strips, and specifically adding the time dimension to the concept of a looped strip with a single side, a 2D object embedded in a 3D space (with, of course the 4th dimension of time) I would be loathe to neglect the MÖBIUS - Federation Square project by ENESS which used sculpture and stop-motion animation to extend the concept to 4D.
Twenty-one large triangles animated by Melbourne, throughout Federation Square. MÖBIUS is a sculpture that can be configured into many cyclical patterns and behave as though it is eating itself, whilst sinking into the ground. The result is an optical illusion and a time-lapse of people interacting with the sculpture and moving through Melbourne's landmark location throughout the day.
MÖBIUS was animated over two weeks Friday, Saturday & Sunday between the 6th - 20th of May 2011.
The 'making of' video is also inspiring. I love the public participation in art, design and whimsy.
Something a little different today. Vi Hart has a whole series of videos called 'Doodling in Math Class' which are awesome (which you can find on YouTube). While she disavows having a love for numbers, seeming to favour geometry over algebra, these are wonderfully talky videos with a real love of the beauty of mathematics (over the unloveable way it is too often taught) and drawing.
I confess, I think in a very similar way sometimes. I'm flumoxed by the question, "What are you thinking?", because I'm unconvinced anyone wants to hear this sort of monologue, though I'm charmed hearing hers.


 The first real shift in thinking is of course attributed to
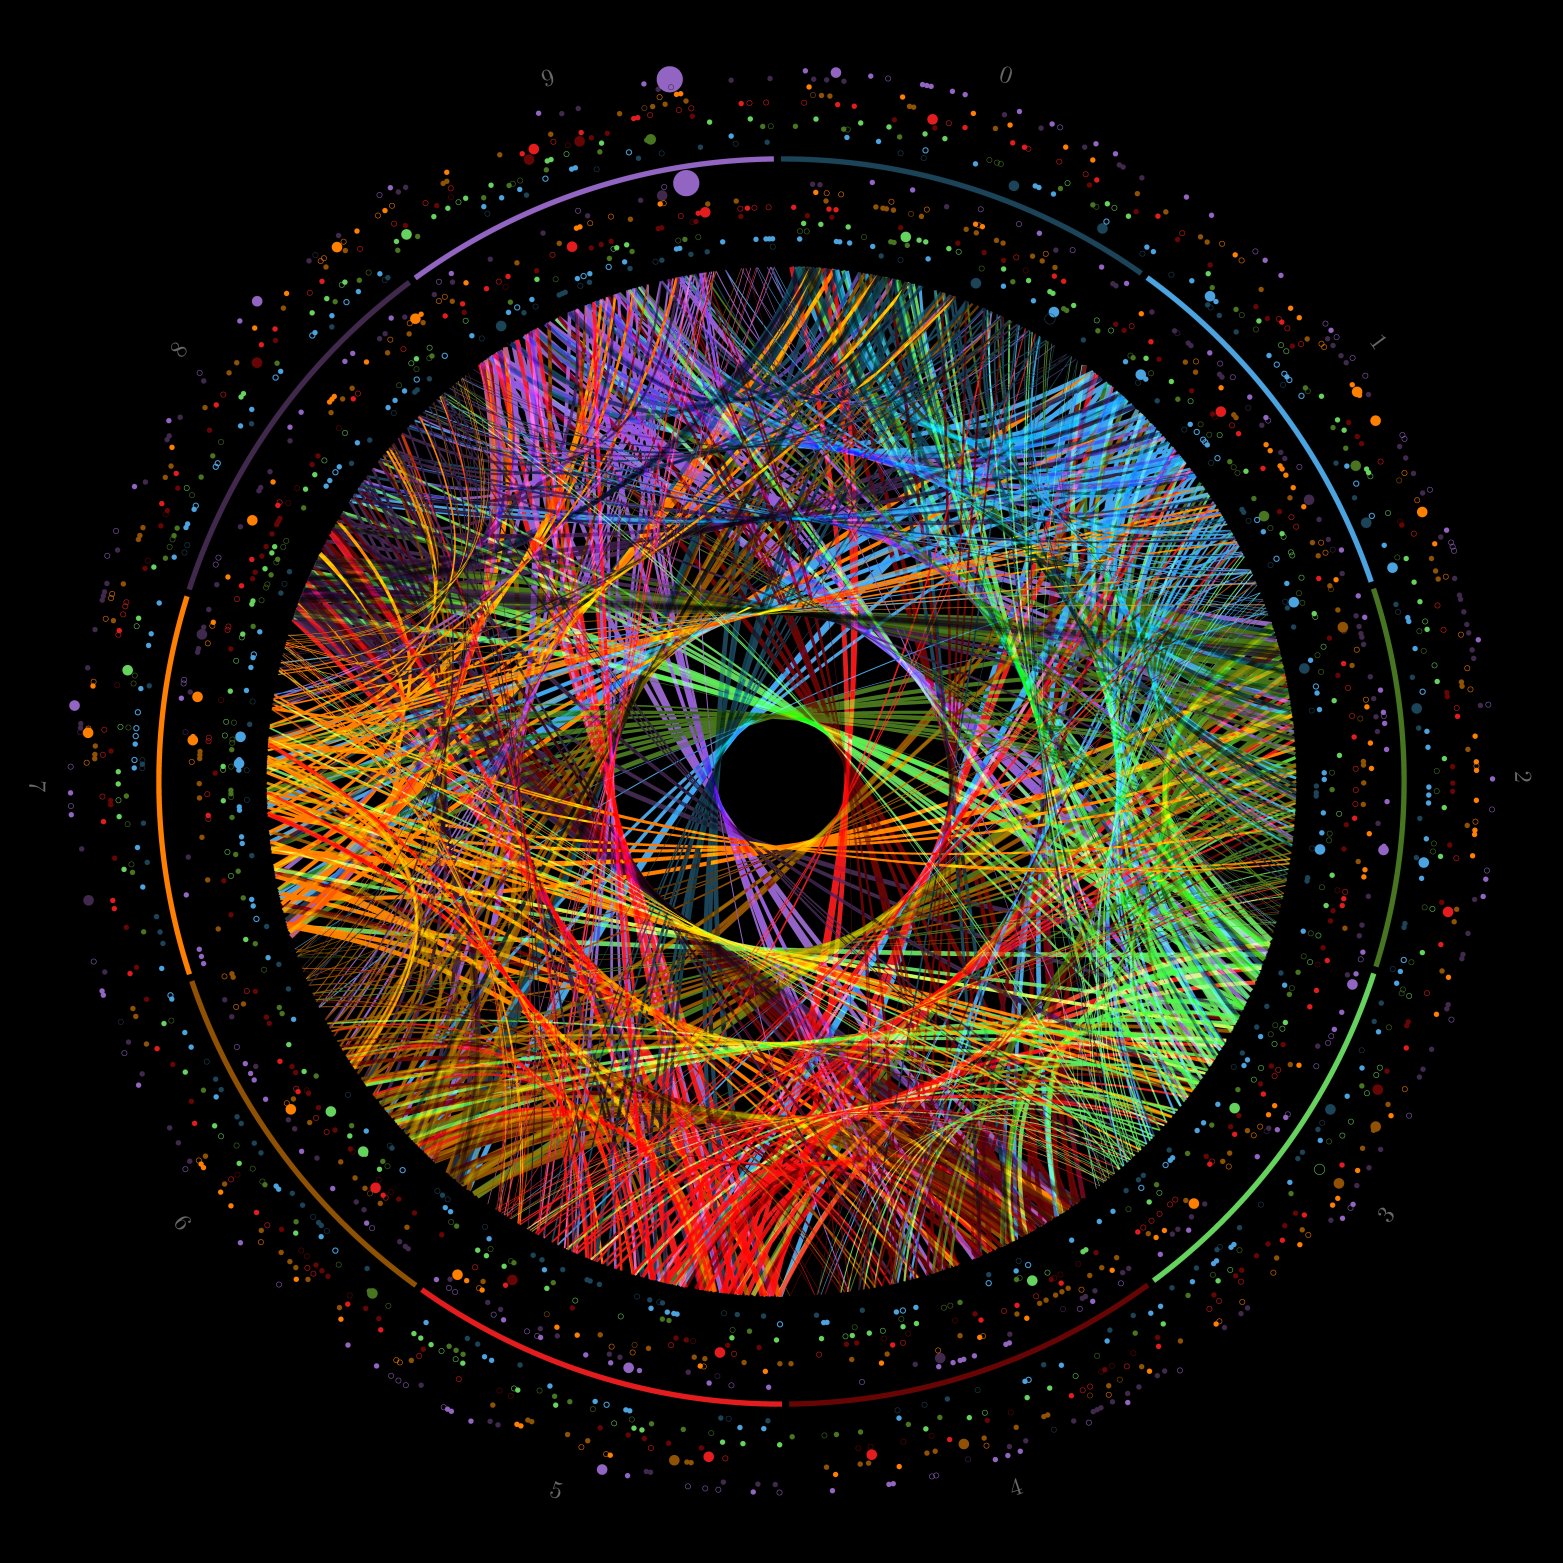